Features
Answers your team can see
Clear visuals for the questions that come up every week, ready to drop into your product.

See the whole picture
Break any total into its parts so you can tell at a glance where the growth comes from.
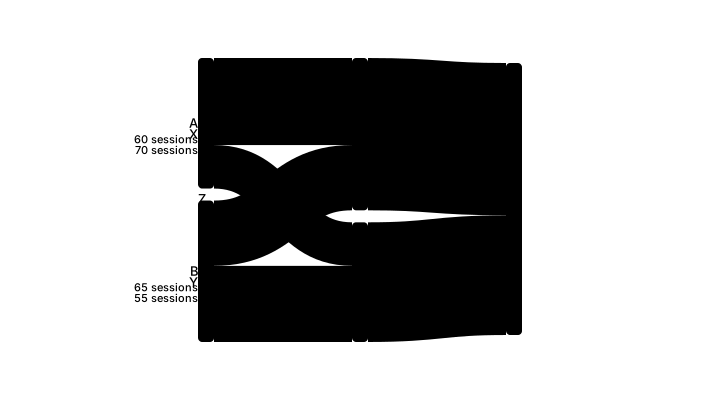
Follow every flow
Trace how visitors move from first click to checkout and spot where they drop off.

Track the goal
Put the one number that matters front and center, with progress everyone understands.